
Aeronautical charts are the primary navigation reference for pilots operating under Visual Flight Rules (VFR). Much like a road map for motorists, these charts provide essential information that helps pilots determine their position, plan routes, identify landmarks, avoid hazards, and navigate safely from departure to destination.
In addition to airports and navigational aids, aeronautical charts depict airspace boundaries, terrain elevations, obstacles, communication frequencies, and numerous other features that are critical for safe flight operations. Understanding how to interpret these charts is a fundamental skill for every pilot.
The FAA publishes three primary aeronautical charts for VFR navigation, each designed for a specific operating environment and level of detail:
- Sectional Charts
- VFR Terminal Area Charts
- World Aeronautical Charts (WAC)
Each chart uses standardized aviation symbols and colors, allowing pilots to interpret information consistently regardless of the geographic region.
Sectional Charts
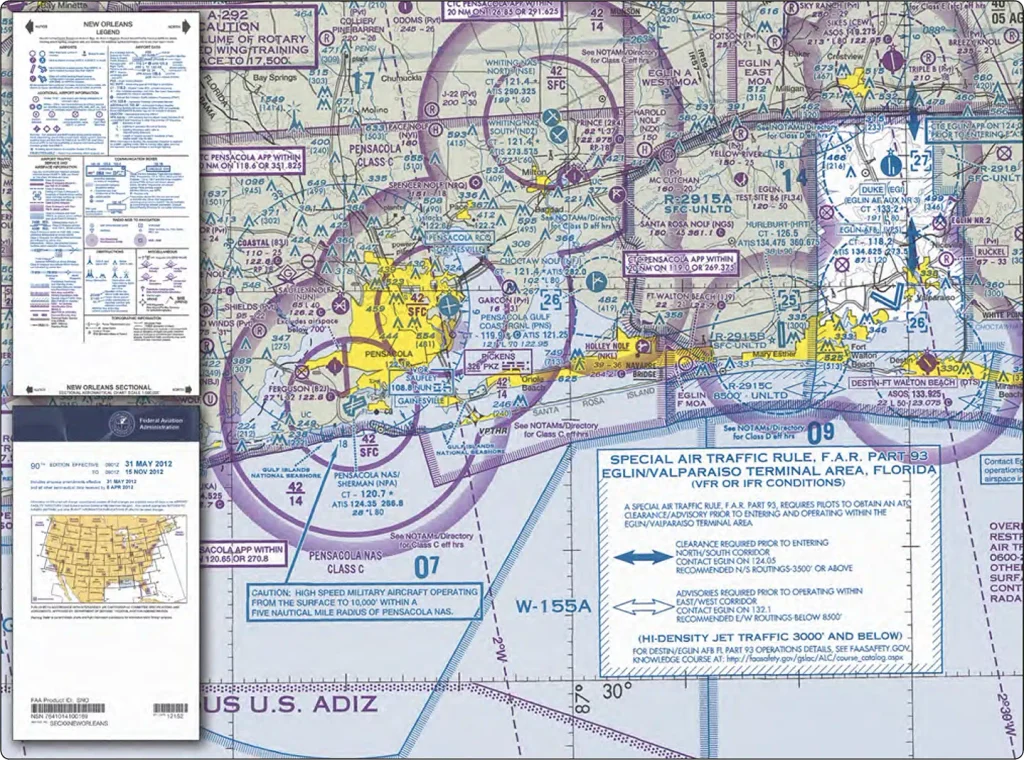
Sectional charts are the most widely used aeronautical charts for VFR flight operations. Produced at a scale of 1:500,000 (1 inch = 6.86 nautical miles or approximately 8 statute miles), they provide an excellent balance between geographic coverage and chart detail.
Sectional charts contain a wealth of information necessary for flight planning and navigation, including:
- Airports and runway information
- Radio navigation aids (VORs, VORTACs, NDBs)
- Airspace classifications
- Communication frequencies
- Terrain elevations
- Obstructions such as towers and power lines
- Cities, rivers, highways, railroads, and other landmarks
- Maximum Elevation Figures (MEFs)
Pilots rely on these charts to identify visual checkpoints, monitor progress during cross-country flights, and maintain awareness of surrounding airspace and terrain.
Figure 1 shows an excerpt from the legend of a sectional chart. By referring to the legend, pilots can interpret the symbols, colors, and markings used throughout the chart. The legend also includes information on airspace classifications, airport symbols, communication frequencies, and other important chart features.
Sectional charts are generally revised semiannually, although charts covering certain areas outside the conterminous United States are revised annually.
VFR Terminal Area Charts
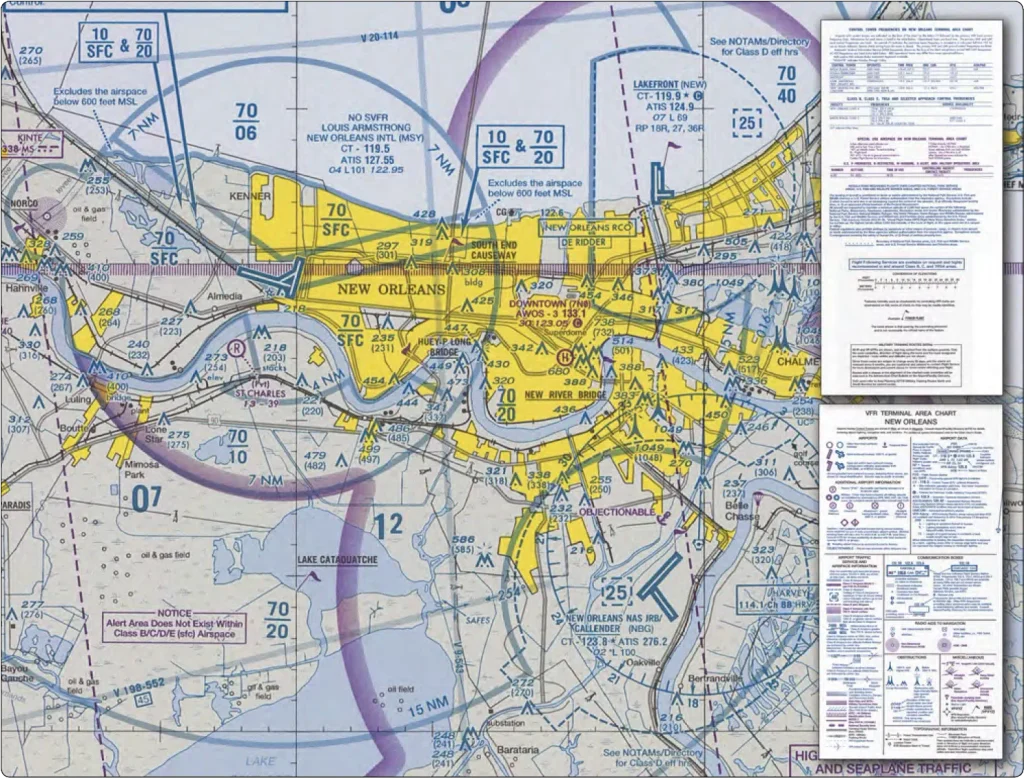
VFR Terminal Area Charts (TACs) are designed specifically for operations in and around busy Class B airspace, where traffic density and airspace complexity are significantly greater.
These charts use a larger scale of 1:250,000 (1 inch = 3.43 nautical miles or approximately 4 statute miles), allowing considerably more detail than sectional charts.
Because of the increased scale, Terminal Area Charts provide:
- More detailed topographical information
- Improved depiction of Class B airspace boundaries
- Additional visual checkpoints
- Better representation of airports and surrounding features
- Enhanced navigation in congested metropolitan areas
These charts help pilots accurately identify reporting points, transition routes, and nearby airports while operating in complex airspace environments.
Figure 2 illustrates a typical VFR Terminal Area Chart.
Like sectional charts, most Terminal Area Charts are revised semiannually, with a few Alaskan and Caribbean charts following different revision schedules.
World Aeronautical Charts
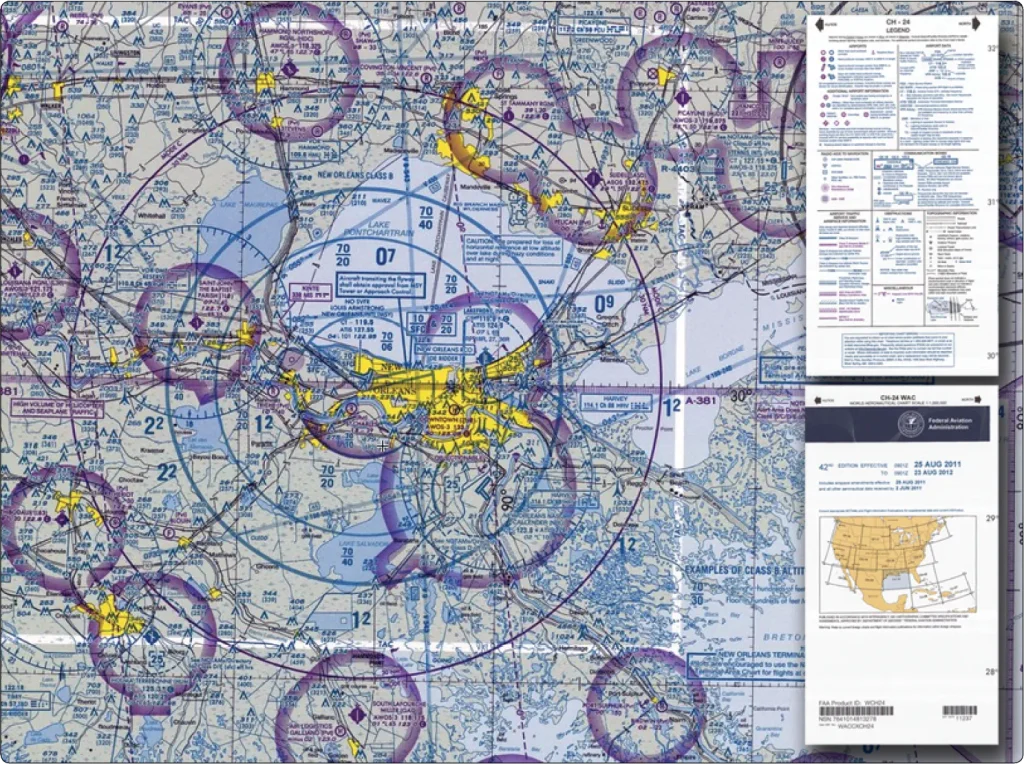
World Aeronautical Charts (WACs) are intended for navigation over large geographic regions by moderate-speed aircraft.
Produced at a scale of 1:1,000,000 (1 inch = 13.7 nautical miles or approximately 16 statute miles), these charts cover much larger areas than sectional charts but include less detail.
Although they use the same symbols as sectional charts, many smaller features are omitted because of the reduced scale.
World Aeronautical Charts are suitable for:
- Long-distance VFR navigation
- Ferry flights
- Flight planning over large geographic areas
- Operations where broad area coverage is more important than detailed information
Figure 3 shows a typical World Aeronautical Chart.
Most World Aeronautical Charts are revised annually, although several Alaskan and Mexican/Caribbean charts are revised every two years.
Where to Obtain Current Charts
The FAA provides a free catalog listing aeronautical charts and related publications, including ordering information and pricing, through its Aeronautical Navigation Products website. Pilots can obtain the latest chart editions before flight from this resource.
Many pilots also use current digital charts through Electronic Flight Bag (EFB) applications. Whether using paper or electronic charts, pilots should always ensure they are current and contain the latest aeronautical information.